
Debugging VRM Designs Using the Bode 500, MXO58, and Eval Boards to Isolate Power Issues
- Emily Tann
- Jul 24, 2025
- 7 min read

There’s a unique mix of excitement and anxiety that comes with powering up a new hardware design for the first time. After weeks or months of meticulous schematic reviews, countless layout changes, and thorough simulations, the hope is always the same: maybe it’ll just work on the first try. But more often than not, that hope gives way to the harsh reality—something’s not working correctly. Whether it's an unstable output, unexpected thermal behavior, or a total lack of power, troubleshooting a VRM design can quickly become overwhelming. With dozens of components and a myriad of possible causes, it's hard to know where to begin troubleshooting. That’s where vendor-supplied VRM evaluation boards come in—not just as development tools, but as powerful diagnostic references that can turn guesswork into insight. These evaluation boards are used to test and validate components or products before you incorporate them into a new design, serving as essential tools for proof-of-concept work and prototype development.
How Can You Verify EVM Designs for Optimal Performance?
Of course, vendor evaluation boards aren’t flawless. Like we've covered previously, just because a manufacturer’s demo board design seems like a perfect fit for your needs, you should never blindly implement their design onto your own board without performing your own measurements first. You should use these evaluation boards to analyze the performance of your VRM designs before final integration, making sure they are suitable for their specific usage. Evaluation boards offer various functions for testing and troubleshooting, allowing you to assess different aspects of your circuit. But, when paired with your own frequency and time-domain measurement instruments and tools, such as impedance measurements with a Bode 100 or Bode 500, step load responses using the S10 or S50 probe heads, and ripple analysis using a low-noise oscilloscope like the MXO58, eval boards become a powerful tool for isolating and understanding behavior. This lets you compare your full, complex design to a much smaller, focused area, and identify whether your issue lies within the VRM itself, or somewhere else in your power distribution network. Different measurement methods and analysis techniques are used throughout this process to fine tune accurate and reliable results.

How are EVMs Used in Real-World Hardware Troubleshooting?
Take, for example, an issue I experienced with a recent board bring-up. Everything looked great in the initial simulation and measurement of the MPM3690-50A VRM eval board — clean output and a nice, flat impedance, indicating high stability. But, when I powered on our designed board, the output rail of the same VRM showed nearly 10% ripple with a 5 kHz oscillation (Figure 2), completely out of bounds of our 5% ripple spec. Along with this significant ripple, impedance measurement of this board also shows a sharp peak that was not seen on the EVM impedance measurement (Figure 3). The discrepancy between what I saw on the eval board and what I measured on my own hardware was a shock; however, if I'm able to recreate this large ripple on the eval board, I'll have identified the cause and thus would know how to fix the problem on my own board. This would be much simpler and less time-intensive than picking at every component in our design, a common challenge in circuit troubleshooting for power issues.
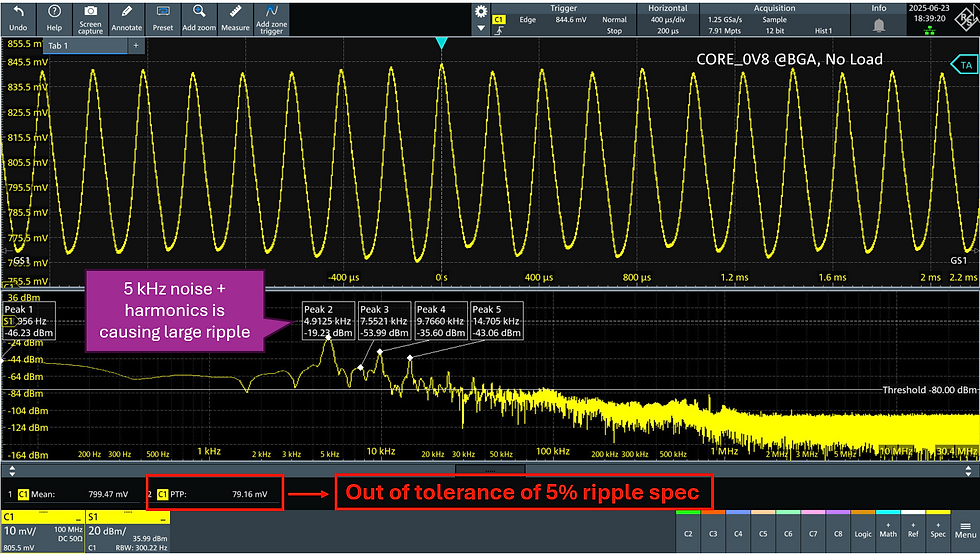

Starting with an impedance measurement using the Bode 500, as seen in Figure 3, initial impedance measurements of the VRM eval board greatly differed from the impedance after implementation into our design. In the impedance measurement of our board, when the VRM is turned on, we see a massive impedance peak around 5kHz, with a NISM (Non-Invasive Stability Measurement) of 5.945°, and a harmonic at 10kHz. However, this correlates perfectly to the frequency of the ripple seen in Figure 2. For reference, as a general rule of thumb, stability margins below 45° can be considered unstable. Per NASA's Engineering Best Practices, 45° phase margin is considered generally acceptable, though not ideal, while 60° is typically the benchmark for stability. Clearly, something is causing instability our design, but where do we start troubleshooting? Easy! As I mentioned previously, if we can recreate this ripple / impedance peak on the eval board, this will lead us to the root of the problem, and thus, a solution for our power management challenges.
After ensuring all modes and configurations on the eval board matched those on our design, I re-measured the impedance on the EVM and I was still not seeing any significant instability. Our next step was to add our bulk output capacitors (3x 1500uF) to the EVM. To our surprise, we now saw some instability (NISM of 17.769°) around 5kHz (Figure 4).

But why? What is interacting with these capacitors to cause this instability? After further investigation, I found that within the MPM3690-50B VRM, there are two parallel 0.22uH inductors, or 0.11uH equivalent inductance. Using equation (1) and knowing we had at least 4500uF of bulk capacitance on the output voltage rail, we calculated an expected LC resonance around 7kHz, quite close to our 5kHz ripple frequency, so we suspected this to be the root cause of our large ripple and the source of the power issues.

What are the Results of VRM Troubleshooting with Evaluation Boards?
Now, to test this theory on our design. After the removal of 3x 1500uF capacitors on the VRM output rail, we now see 2.34 mVpp ripple where we originally saw 79.16 mVpp ripple. This is a 97% reduction in ripple, as well as a -35 dBm improvement in the 5 kHz peak. We are now passing our ripple spec with plenty of margin. Ultimately, this was achieved with little to no experimentation on our own board. This process may have consumed significantly greater time had we not used the eval board for our troubleshooting efforts for VRM debugging. Although this could have been caught much earlier in the design phase with simulations, no simulation model was available for this VRM. Vendor-provided VRM models are not widely available — that's why Signal Edge Solutions provides services including creating measurement-based models for your needs.

Closing Thoughts
While VRM evaluation boards are incredibly useful tools for troubleshooting and design insight, their true value emerges when paired with thorough simulation and measurement. In this case, the eval board helped isolate a significant ripple issue, but it was only through carefully replicating our design conditions and validating them with impedance and ripple measurements that we identified the root cause. Relying solely on the default eval board configuration would have masked the underlying problem. This experience reinforces a critical lesson: never assume a vendor eval board design will behave identically in your system. Instead, use it as a controlled reference point, and always perform your own validation to understand how your specific components and layout impacts performance. With this in mind, evaluation boards become powerful allies in achieving reliable, spec-compliant power delivery.
Equipment List
For your reference, expand the tables below for additional information regarding the equipment utilized in my measurements. Click any of the links to go directly to the product page in the Signal Edge Solutions store. Or, if you need, the Signal Edge Solutions team is more than happy to assist you with our measurement services.
Impedance Measurements
Description | Equipment |
Vector Network Analyzer (VNA) | |
Differential Amplifier (Ground Loop Isolator) | |
Power Supply | |
2-Port Transmission Line PDN Probe | |
Probe Holder | |
RF Adapters |
Ripple Measurements
Description | Equipment |
Oscilloscope | |
Power Supply | |
Electronic Load | Keysight EL34143A |
1-Port Transmission Line PDN Probe | |
Probe Holder | |
RF Adapters |
Step Load / Transient Response Measurements (<10A Load)
Description | Equipment |
Oscilloscope | |
Power Supply | |
Arbitrary Waveform Generator (to drive S10) | |
1-Port Transmission Line PDN Probe | |
1-Port Transmission Line PDN Probe with S10 Interchangeable Head | |
Common Mode Isolator (to break the ground loop) | |
2x Probe Holder | |
RF Adapters |
Step Load / Transient Response Measurements (>10A Load)
Description | Equipment |
Oscilloscope | |
Power Supply | |
Arduino + Nano boards (to drive S50) | Arduino + Nano boards |
1-Port Transmission Line PDN Probe | |
Water-Cooled Load Stepper | |
2x Probe Holder | |
RF Adapters |
References:
2-Port Impedance Measurement using the P2102A Probe and E5061B VNA | Signal Edge Solutions
2-port PDN Impedance Measurement of a Power Supply | TI TPSM8D6C24 | Signal Edge Solutions
GN&C Engineering Best Practices For Human-Rated Spacecraft Systems
Omicron Bode 100 Vector Network Analyzer | Signal Edge Solutions
Omicron Bode 500 Vector Network Analyzer | Signal Edge Solutions
Picotest P2105A Probe-Based Stepper (S10) | Signal Edge Solutions
Picotest P2105A 1-Port Low Noise TDR - Ripple Browser Probe | Signal Edge Solutions
Picotest Water-Cooled Head Stepper <50A (S50) | GaN-enabled | Signal Edge Solutions
R&S® MXO58-ULTM Configured Oscilloscope | Signal Edge Solutions


Nice article, but I’m not sure the 45°–10 dB Bode plot stability criterion really applies here. The MPM3690-50B uses a multiphase (M)COT architecture, and since COT control introduces a non-linear element into the feedback loop, the system isn’t strictly LTI-compliant. Because of that, I’m not convinced NISM values are valid in this context.
With an LTI-compliant architecture, the criterion would definitely hold. What I usually do is check the supplier’s datasheet to see if they’ve included Bode plot measurements, but in this case I only found load-step graphs. In situations like this, I typically ask the supplier directly whether Bode plot measurements are meaningful or not.